
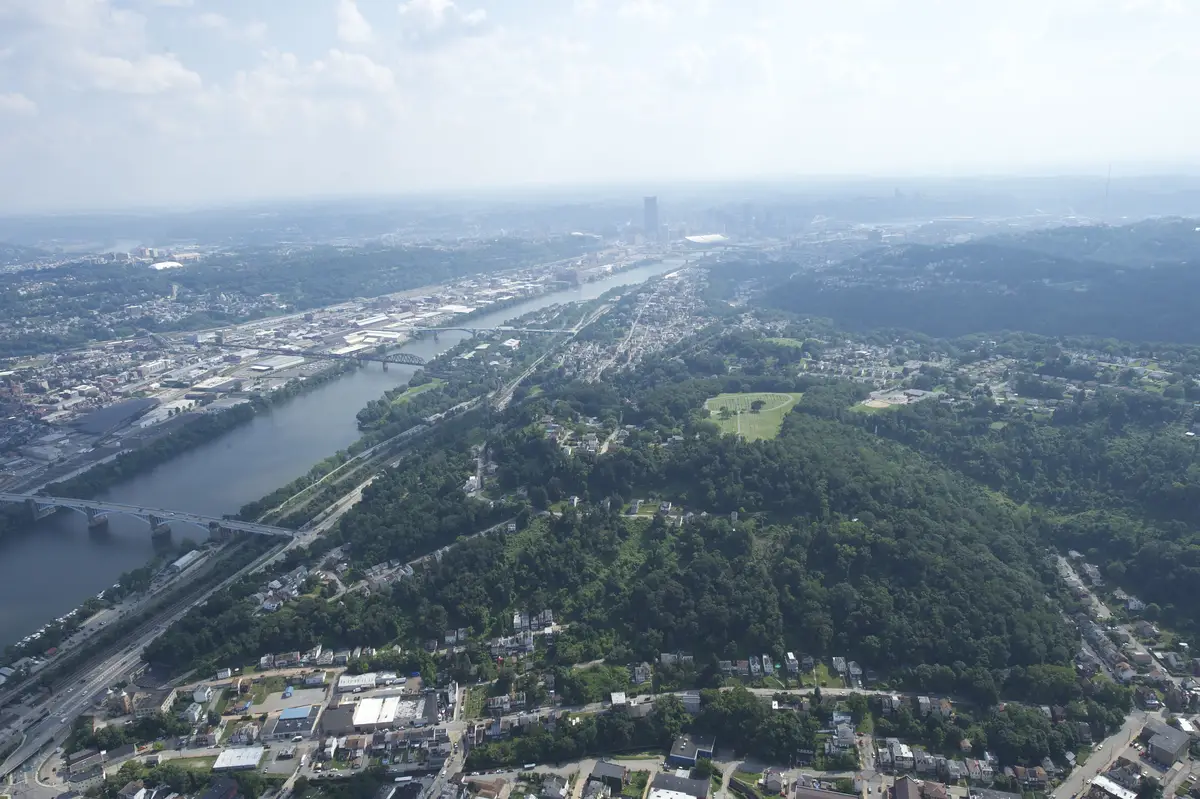
Pittsburgh’s summers are becoming increasingly hotter, and its air quality issues remain persistent. In response, researchers at Carnegie Mellon University are transforming environmental data into actionable tools for residents, advocates, and policymakers. These tools aim to pinpoint risks, facilitate informed decision-making, and enhance the overall well-being of the city’s inhabitants.
Recent studies conducted by CMU have revealed which sections of Pittsburgh experience the most intense heat and how various building types and road surfaces influence a neighborhood’s ability to endure summer temperatures. This research contributes to CMU’s expanding repository of publicly accessible environmental data.
In examining Pittsburgh’s “heat islands”—areas where temperatures are significantly higher than their surroundings—CMU researchers identified that poorer, historically segregated neighborhoods are often warmer by nearly six degrees on average compared to wealthier areas. This temperature disparity adversely affects at-risk populations, including children, the elderly, and individuals with health conditions that heighten their vulnerability to heat-related ailments.
“We know there are negative climate impacts when we remove natural soil and cut down trees to build things,” said Suzy Li, a recent Ph.D. graduate from CMU’s School of Architecture and the principal investigator of the project. “However, what people don’t usually think about is how the design and building materials can impact the temperature.”
More Trees Plus Lighter Streets Equals Cooler Neighborhoods
Utilizing high-resolution satellite imagery alongside city data, Li discovered that a scarcity of trees and an abundance of dark, impervious surfaces, such as parking lots, contribute to higher temperatures. These surfaces absorb more sunlight and emit more heat compared to light-colored infrastructure. In contrast, features like parks, green roofs, and tree canopies can reduce neighborhood temperatures. Specifically, Li found that increasing a neighborhood’s tree coverage by just 10% could lower temperatures by 3.4 degrees.

“My research offers a detailed analysis of the city’s surface materials by color and how they contribute to the surface temperature differently,” Li explained. “The goal is not to avoid development at all, but to show how we can make smarter decisions and minimize our impact or integrate more green surface to shift it to a positive impact during our design.”
In her examination of Pittsburgh, Li found that 55% of the city is covered by impervious surfaces, including roads, roofs, and parking lots. Notably, over half of the roads are dark in color, a finding that was unexpectedly low for Li, considering the prevalence of dark roads elsewhere. For comparison, Li’s research on Los Angeles revealed that 70% of its streets are black.

“My hypothesis is that asphalt tends to get lighter when it ages, and because Pittsburgh roads are not very frequently resurfaced, that might explain the higher percentage of light roads here,” she said.
Li’s research further indicates that greenery and lighter surfaces can significantly mitigate neighborhood temperatures. On a sweltering day, a standard dark roof can reach temperatures as high as 165 degrees Fahrenheit, whereas a building with a green roof might only reach 85 degrees.
To guide future urban planning, Li developed a Smart Surfaces Guide, outlining strategies for designing and constructing homes and neighborhoods that adapt to a warming climate.
The guide highlights how choices like planting trees, using solar panels for shade in parking lots, and creating rain gardens to manage stormwater can notably decrease temperatures and enhance urban infrastructure.
Data Built by Pittsburgh, for Pittsburgh

The same populations disproportionately affected by rising temperatures are also vulnerable to Pittsburgh’s ongoing air pollution issues. Quantifying and translating air pollution trends into meaningful data can be challenging for affected residents. However, CMU researchers have developed tools to address this issue as well.
Ana Hoffman, air quality program director at CMU’s CREATE Lab, explains, “We take public datasets and turn them into something that can be used to inform policy and help decision makers make air quality better in Pittsburgh.”
Hoffman manages CMU-developed applications like PlumePGH and SmellPGH, which compile residents’ air pollution reports. Her team overlays this community-driven data with the latest government air dispersion models to correlate pollution sources with observed pollution plumes.
“We’ve seen a lot change locally,” Hoffman noted. “Air quality has improved over the last 10 years, thanks to the work of the Breathe Collaborative, which we’re a part of, that brings together local advocacy organizations like the Group Against Smog and Pollution (GASP) and others. There have been measurable improvements that are visible in the data, but it’s definitely not all the way there.”
Hoffman cited high cancer and asthma rates in Allegheny County as a continuing impetus for improvement. Yet, she is optimistic about the lab’s technology reaching beyond Pennsylvania.
The lab extended SmellPGH into Smell MyCity, an app usable in any city or state to track pollution odors. Hoffman noted that Louisville, Kentucky, Portland, Oregon, and the state of Maryland have adopted it as their official air quality odor reporting systems.
“It’s incredible. We’re seeing people advocating for their government agency to incorporate the reporting data into enforcement policies,” Hoffman stated. “To make change happen, it’s really important to collect this data, make sure it’s in the hands of the right people, and that it’s understandable.”
Read More Here




Comments are closed.